LT1-
I can explain the founding systems of American Government:
LT1b.
I can describe how the powers of government are separated and how they are kept
in balance.
LT1e.
I can identify and describe the major principles behind the American
Constitution.POD:
1. Do Now
2. Constitutional Structure Review
3. BoR Discourse (and data gathering)
4. Infographic Review
5. Exit Ticket (from yesterday's SLO work)
TASK 2:
Reviewing the CONSTITUTION STRUCTURE
|
1.
Infographic 1: Create a WORD CLOUD, based on your
ARTICLE. Use wordle.net and http://www.archives.gov/exhibits/charters/constitution_transcript.html
|
|
|
PROS
|
CONS
|
|
|
|
|
2.
Infographic 2: On backside--
|
|
|
PROS
|
CONS
|
|
|
|

TASK 3:
Constitutional/Bill of Rights Discourse
PART 1
Instructions:
When you meet with the other students, be sure to record the question they had,
the amendment you believe it to be and then whether your answer is yes or no.
PART 2
Instructions:
Gather Data on the class’s opinions for your question. You can do this while
you do Part 1, but be sure that you have addressed 100% of the class’s
opinions.
|
Total
Yeses
|
|
|
Total
Nos
|
|
|
TOTALS
|
|
- With this infographic, what are you trying to show?
- What is the best way to show off this data?
- Can you SKETCH it out here?
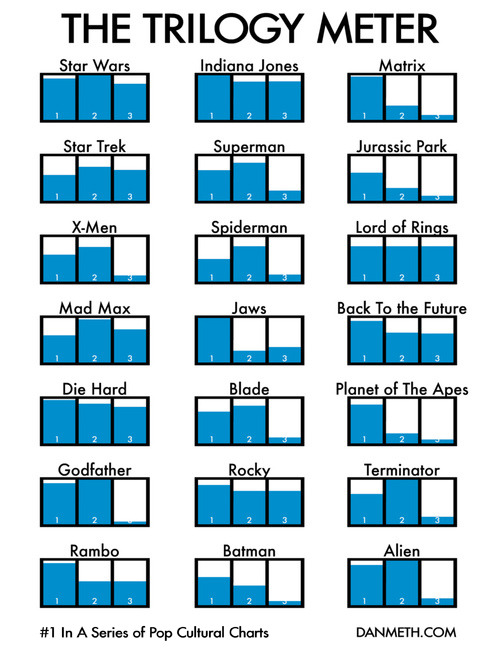
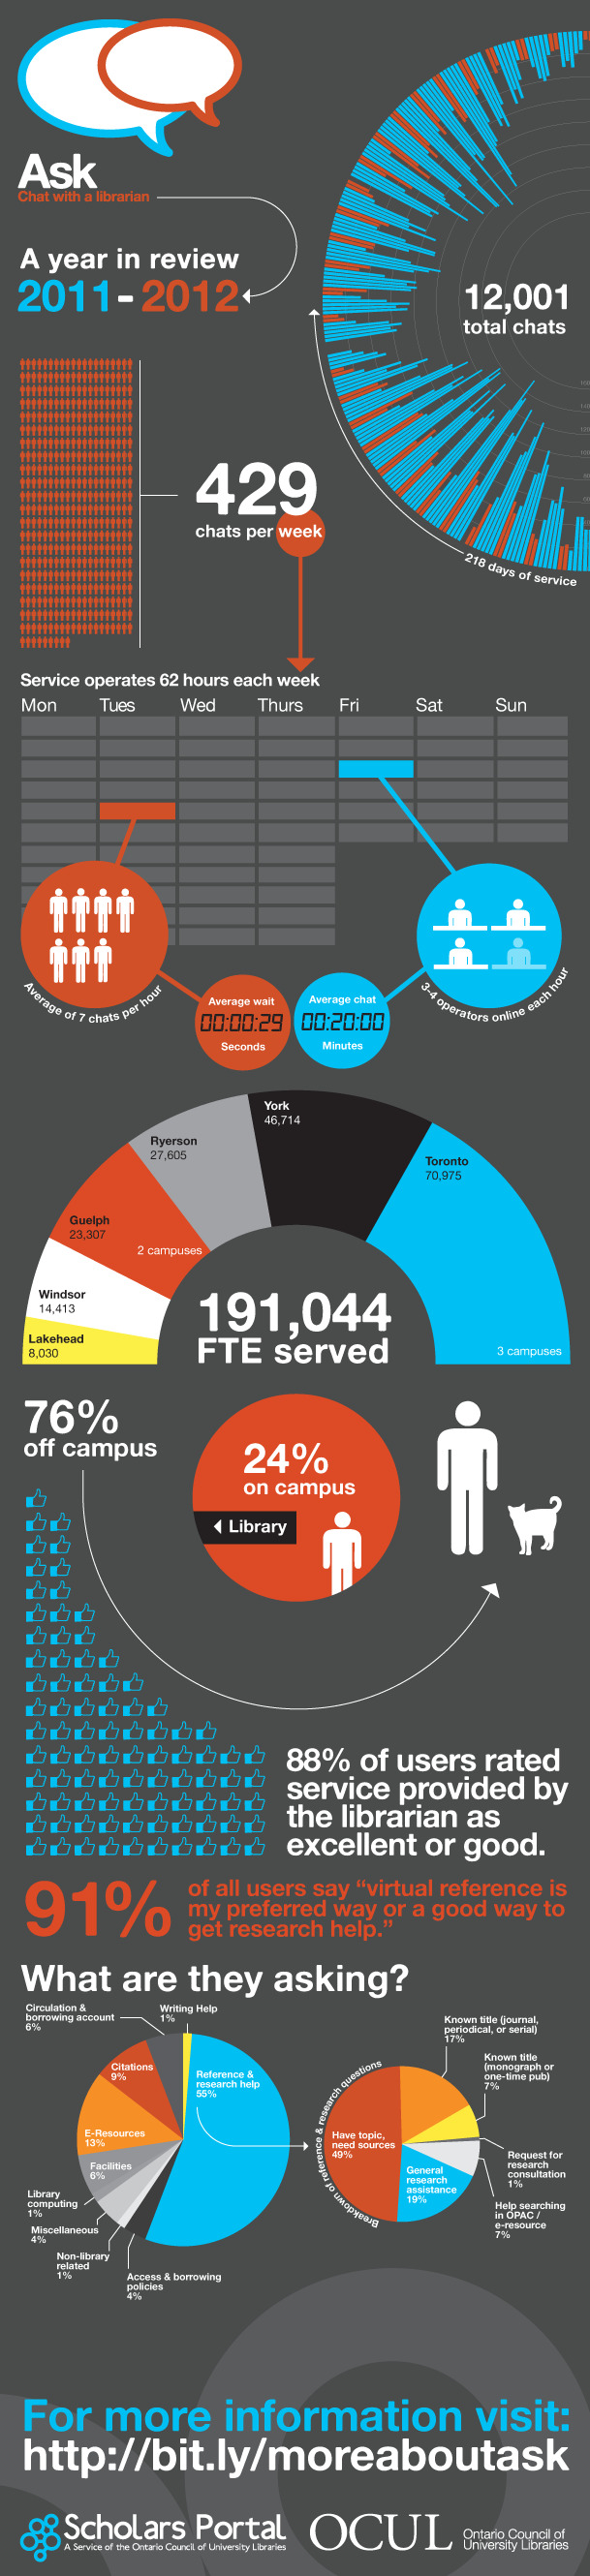
Task 4: CREATING an INFOGRAPHIC
Information graphics or infographics are visual
representations of information, data or knowledge. These graphics are used
where complex information needs to be explained quickly and clearly, such as in
signs, maps, journalism, technical writing, and education. They are also used
extensively as tools by computer scientists, mathematicians, and statisticians
to ease the process of developing and communicating conceptual information.
LT to be ASSESSED:
*EXEMPLARY PERFORMANCE: If
you exceed the expectations for more than 4 categories and do not score ANY
Developing or Beginning skills, you will be awarded EXEMPLARY performance.
|
|||
CATEGORY
|
Meeting
|
Developing
|
Beginning
|
TOPIC/TITLE
|
The
topic of the infographic is specific in nature and is intended to inform or
convince the viewer. The topic chosen
shows the learning target understanding.
|
The
topic of the infographic may be a bit too broad to allow the viewer to
understand the main points. The topic chosen addresses the learning target.
|
The
topic of the infographic is hard to ascertain and needs to be made more
specific. The topic does not connect to the learning target.
|
TYPE
|
The
type of infographic chosen (i.e. timeline, informational, etc.) highly
supports the content being presented.
|
The
type of infographic chosen represents the content being chosen but another
type may lead to more clarity for the viewer.
|
The
type of infographic chosen does not convey the information well or support
the content being presented.
|
OBJECTS
|
The
objects included in the infographic are repeated to support various data
points and to make it easier for the viewer to understand the infographic.
|
Some
objects included in the infographic are repeated but the infographic did not
seem to include enough repeated elements to make it understandable.
|
Too
many different types of objects are used in the infographic and that makes it
hard for the viewer to understand the content.
|
MINIMUM REQs
|
- 10-15 graphics (photos,
backgrounds, drawings, illustrations, etc.)
- statistics (numbers, percentages)
- titles and captions
|
-
5-10 graphics
-
stats are all same format
-
most images are captioned
|
- fewer
than 5 graphics
-
stats are missing/funky
-
no captions, so images are confusing.
|
DATA VISUALIZATIONS
|
The
data visualization formats chosen make the data presented easy for the viewer
to understand the information.
|
The
data visualization formats chosen showcase the data, but some may make it
difficult for the viewer to understand .
|
Other
data visualization formats should be chosen to best showcase the data
presentation for the viewer.
|
DATA ACCURACY
|
All
of the information is accurate and has been thoroughly researched.
|
All
of the information is accurate, but I retrieved info from only one source.
|
My
information is either inaccurate or I did no research.
|
FONTS
|
The
infographic includes an appropriate font to both complement the content and
make the text readable.
|
The
infographic includes multiple fonts and/or the fonts do not seem related to
the infographics topic.
|
The
font(s) used in the infographic make the text almost unreadable.
|
COLORS
|
The
color choices enhance the visibility of the infographic. Different
saturations of the same color are used wisely.
|
The
color choices are fine, but too many colors may have been used.
|
The
color choices for the infographic are not visually pleasing and detract from
the infographic.
|
LAYOUT
|
The
layout of the infographic adheres to the inverted pyramid style - main point
on top, secondary point next, and supporting details at the bottom.
|
The
layout of the infographic includes all three components -main point,
secondary point, and supporting details - but is not organized in the
inverted pyramid style.
|
The
infographic is lacking one or two of the components of good infographic
design - main point, secondary point, or supporting details.
|
INFORMATION ORGANIZATION
|
The
infographic utilizes one of the LATCH (location, alphabetical, timeline,
category, or hierarchy) information organization formats to allow the viewer
to understand the information in the infographic.
|
The
infographic utilizes some components of the LATCH (location, alphabetical,
timeline, category, or hierarchy) information organization formats, but some cohesiveness
of the information presentation is lacking.
|
No
information organization choice (location, alphabetical,timeline, category,
or hierarchy) is present in the infographic.
|
CITATIONS
|
Full
bibliographic citations for all sources used are included and show thorough
research.
|
The
URL of sources used are included.
|
No
citations to sources used are included.
|
** Please note that plagiarized
work will be considered as LT score of 0.
HOMEWORK:
1. Take the Naturalization AOL on Thursday/Friday (do the full length quiz here to practice)
2. Infographic Due MONDAY 5/6.
3. Need an extra HOW HD grade? Do this game and email Mrs. Marsh the results:
3. Need an extra HOW HD grade? Do this game and email Mrs. Marsh the results:
Fourth
Amendment Game: http://teachingfoundingprinciples.org/
No comments:
Post a Comment